
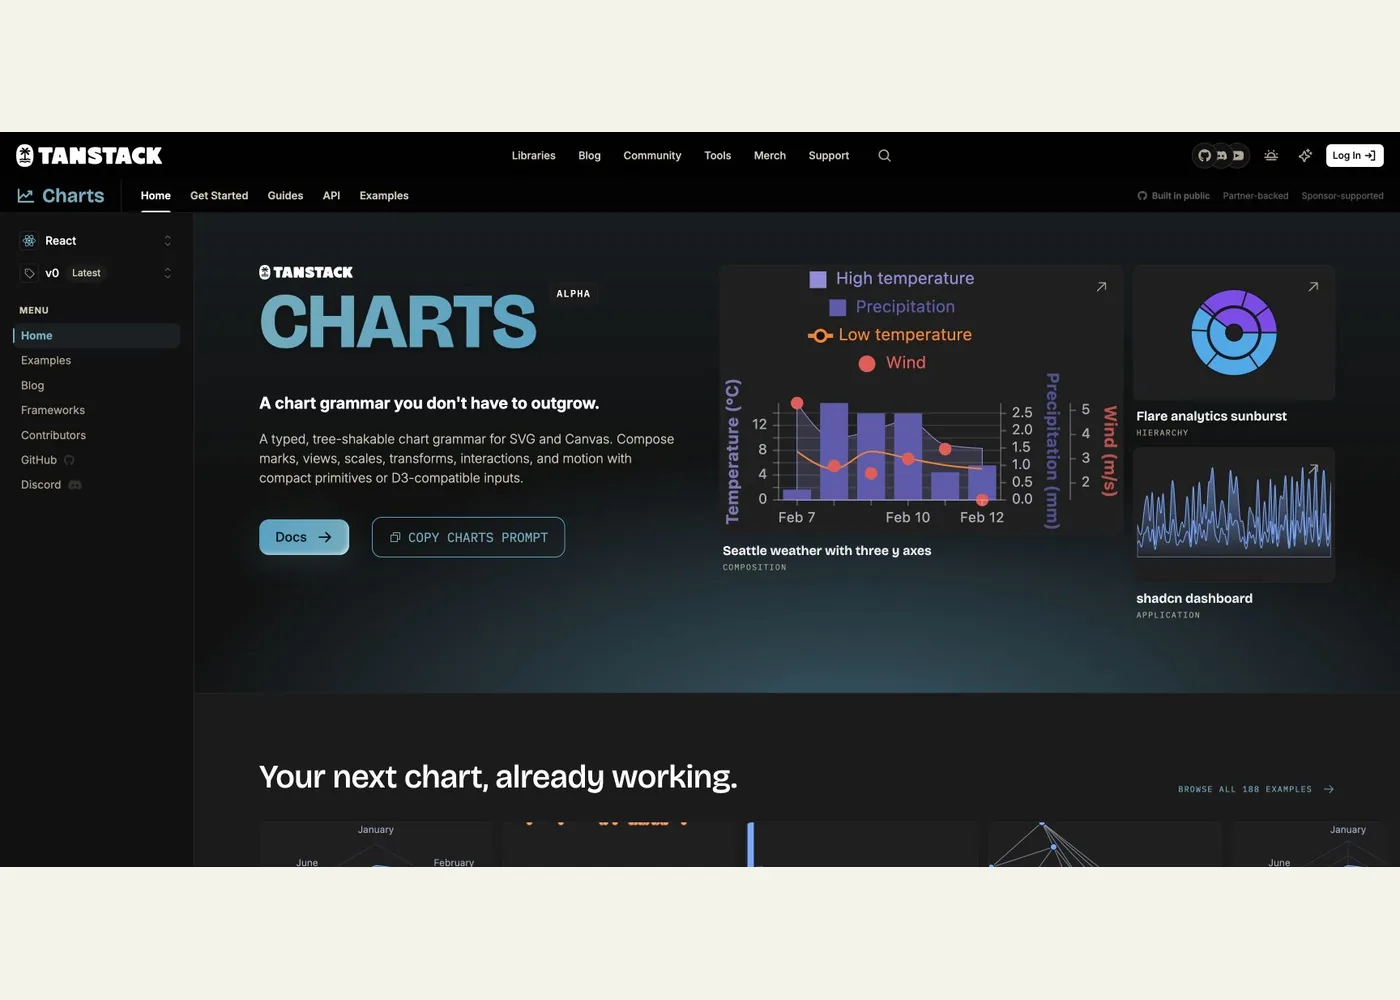
TanStack Charts
TanStack Charts is a TypeScript and JavaScript library for developers who want to build responsive charts inside an application. Its chart grammar lets you compose marks such as lines and dots, map data fields to visual channels, and choose scales. The same definition can feed a browser host or framework adapter. It renders SVG by default, with Canvas available for selected hosts. This makes it useful when a dashboard needs more than a fixed menu of chart types, but the team still wants a typed, declarative way to build them.
The example catalog is a practical place to judge fit before adding a dependency. It includes common line, bar, scatter, and area charts alongside distributions, maps, hierarchies, interactions, and composed views. Use it to inspect how a chart is assembled and whether its visual and interaction patterns suit your data. The library handles chart layout, rendering, and chart interactions; fetching, cleaning, application filters, and persistence remain in your app or data layer, as its overview explains.
To start, follow the installation guide and add @tanstack/charts, plus the peers for your chosen framework adapter. The quick start builds a line chart from rows with month and revenue fields: declare a line mark, assign point and linear scales, give the chart an accessible label, then mount it in a container. React developers can use the separate React quick start. Try one small chart with representative data before adapting a larger dashboard.
The project is in alpha. Its published API can change across minor releases, and the live documentation follows unreleased main. For a production evaluation, pin the package version, check the matching release documentation, and test upgrades. Complex data preparation and specialized scales may also need your own code or additional D3 modules.
Example use cases
- Suggested application: Build a sales dashboard that overlays monthly revenue and target markers while keeping tooltips tied to the original records.
- Suggested application: Add a linked chart and data table so analysts can inspect selected observations in both views.
- Suggested application: Prototype a distribution chart for performance measurements, then compare SVG and Canvas rendering for the expected data volume.
Sources
Source image: Screenshot of TanStack Charts by TanStack.
Maintained by Jetskibay. Reviewed 2026-09-29T00:00:00Z.